
I might complain about my brother sometimes...especially how he takes up so much of mom's time...but I've decided that he really is a nifty fellow. Why the change of heart? My brother has started to play with me! He laughs when I poke his nose and tries to take toys out of my hand. Right now he' taking a nap....so I'm off to edit some reports!
Executive Report Tips:
SolarBot Loyalty Revenue
This report is tricky, but I don't want to give away the solution! Something that helped was saving the report frequently. When I made mistakes, I simply reverted to the last saved version.

Confused? Take a break, grab a snack, and watch this video. If you are short on time, start around the 20 minute mark. Still stuck? Leave a comment for the Trailhead Baby!
Report Modifications:
Sales
Two words: Filter Logic
Support
If you get this error...try stacking to 100% and make sure that you have a "horizontal" style chart.


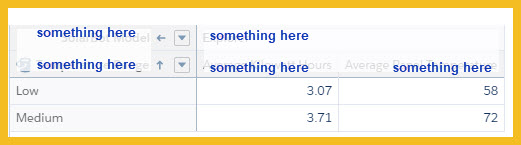
R&D
Getting this error message? Here's a few hints:
1) Use the chart style "column"
2) Check out the graphic below - It should help you get started!


I am stick on Step 6. It cannot not find my solarbot lightning record type page. Any tips here?
ReplyDeleteDouble check the spelling- The challenge is likely looking for the page's name to be exactly what is stated in the instructions. Also, make sure that you created the correct type of lightnting page & placed the component on the page. Still stuck? Share some details of what you have.
DeleteHi Trailhead Baby - I'm stuck on Step 6 as well, saying that it can't find my page. I've created the page and assigned it as the app default (and the default for everything else under the sun). And I copy/pasted the name. Any guidance you could provide would be a-mazing! Thanks!
ReplyDeleteOn the page, is the developer name this: SolarBot_Status_Page_With_Chart ?
DeleteCould you share a few more details?
I am having the same issue. My page looks exactly like screenshots of passing pages, but Trailhead says "We can't find a page with the name 'SolarBot Status Page with Chart'"
Delete
DeleteDid you check the developer name of the chart? If you created/re-created it a few times, it may have the wrong name since the API/developer names must be unique.
Also- Did you activate the page?
For anyone struggling with this as I did in 2022, make sure that the object you select is "SolarBot" and not "SolarBot Status".
DeleteThank you Anonymous for telling me to go to the "SolarBot" Object. I love you!
Deletesame issues with me Challenge Not yet complete... here's what's wrong:
DeleteWe can't find a page with the name 'SolarBot Status Page With Chart'.
Hi Trailhead Baby - I'm stuck on Step 6 wherein I need to create a page for the SolarBot Status Averages.This is the error that I'm getting "The 'SolarBot Status Page With Chart' Lightning app doesn't use the chart from the 'SolarBot Status Averages' report with data specific to the SolarBot." Thanks!
ReplyDeleteCould you share some details of your report? On the lighting page, are you filtering the report?
DeleteHey I'm stuck on 5 and it's telling the incorrect account names are on the report. My concern is that NEXT 45 Days relative fliter, as I was working on this a while back but now all the warranty expirations are past. Did I screw myself by putting this down and coming back to it later?
ReplyDeleteThe data shouldn't matter... the challenge "checking" mechanism typically only looks at configuration- not at the data itself. I'm a little confused though- Are you on step 5- the executive report? Could you share the exact error message?
DeleteGot it figured out. i was using the relative date wrong
DeleteGlad to hear!!
DeleteI had to make sure one was grouped in the rows and one in the column sections of the report.
DeleteThank you for this blog, it has been an invaluable resource.
ReplyDeleteI am stuck on Challenge # 6.
Here is the error -
Challenge Not yet complete... here's what's wrong:
We can’t find the additional analysis by model being performed on the 'Temperature to kWh Research' report. Remember that you can organize data horizontally and vertically at the same time.
I cannot find a field called SolarBot Model.
Report / Chart as follows:
Group Rows: Temperature Range Bucket
Group Columns: Cannot locate a field called SolarBot Model - only SolarBot Name?
Columns: # Kilowatt Hours (Average), # Panel Temperature (Average)
Chart is currently horizontal bar, but I have tried various combinations.
Any guidance that you can provide is greatly appreciated.
What custom report type are you using? The "SolarBot Model" is a field on the SolarBot object. You would need a custom report type to have SolarBots and Status information. My guess is that there is a error with the report type if the field is missing.
DeletePerfect, thank you.
DeleteRevisited the SolarBots and Status Data report type. Added SolarBot Model back in to the SolarBot Status field layout properties and passed the challenge.
Onto challenge #7 with enthusiasm renewed, thank you so much.
Hello!
ReplyDeleteThank you so much for this blog!!! I was wondering if you could give me some guidance on an area of Challenge 6 that isnt working out for me. I think I am missing something simple. When I go to add the Report Chart Component to the Lightning Page, I have no options under the Filter By dropdown. I know that I should be able to filter by the SolarBot ID but it wont show up there. Any suggestions? Thanks in advance!
On the SolarBot Status Averages report on the "SolarBot Status Page With Chart" page? The option should be there in the lighthing app builder on the far right after you drop the report in. See it? If not, I'm happy to look at a screenshot (rebecca@capstorm.com)
DeleteThank you so much for your offer of assistance! I just figured out where I made the error. I was creating an app page instead of a record page in the Lightning App builder! Have a wonderful day!
DeleteWorking on this right now. Your below response to one of the questions....how do you get around this? If it needs a unique name. I have tried a few times, and deleted all pages, but it won't take the standard developer name anymore? Any advice?
ReplyDeleteDid you check the developer name of the chart? If you created/re-created it a few times, it may have the wrong name since the API/developer names must be unique.
Also- Did you activate the page?
Developer name... You have to delete the chart/report/etc, empty the recycle bin, then wait 24 hours. After that, the name can be reused. (It's not pretty...but so it goes)
DeleteHi ,
ReplyDeleteTrailhead Baby,
I am stuck in step 6 of Lightning Experience Reports & Dashboards Specialist. I am getting below error:
Challenge Not yet complete... here's what's wrong:
We can't find a page with the name 'SolarBot Status Page With Chart'.
I have Selected
1. record page in lightning app builder and
2. selected object solarbot,
3.used report SolarBot Status Averages,
4.also Activated it
Assigned it to Solarbot App,
Still i am getting this error. I am trying on it from past 2 days.
Could you please help.
I would start by double checking the name of the page- Not the name you gave but the unique Salesforce API name. It should be SolarBot_Status_Page_With_Chart
DeleteIs the page activated as org default?
What can I do if it won't let me change the unique Salesforce API name?
DeleteI have the same error and my API name is SolarBot_Status_Page_With_Chart so it's not that.
DeleteHello Trailhead baby,
DeleteI hope you are great, I have the same issue and I am super stuck. I posted here as well. https://trailhead.salesforce.com/en/content/learn/superbadges/superbadge-lex-rd
Basically the page seems to be there and named correctly (AP)/Dev name), any more pointers please ?
Hi Trailhead Baby,
ReplyDeleteI'm in challenge 6 and facing error "We can't find a graph displaying the requested data on the 'SolarBot Status Averages' report."
and also I'm not able to find the filter 'SolarBot ID' in the page. Kindly help me with this.
Thanks in advance
Did you add a chart to the report? You do not need the solar bot ID column- but there is a field that identifies the status of the solar bot.
Deletehi Traihead Baby,
ReplyDeleteI'm stuck on challenge 5!!!! the error says:-
Challenge Not yet complete... here's what's wrong:
We can’t find a new column 'Adjusted Expected Revenue' on the 'SolarBot Loyalty Revenue' report that meets the requirements.
the formulla i used: IF(Account.Number_of_SolarBots__c:SUM > 0, EXP_AMOUNT:SUM * 1.1, EXP_AMOUNT:SUM)
the format is currency and no filters are been used.Applied the formulla to all summary levels.Can you please guide me where am i going wrong?
Formula is incorrect in syntax- it is missing a "(" and ")" around part of the forumla.
DeleteHow is there an AND () condition missing? There is simply an evaluation of IF the account has any SolarBots records associated via the rollup summary formula.
DeleteHi Trailhead Baby,
ReplyDeleteI'm in challenge 6 pretty much all day and it's giving me the error "We can't find a graph displaying the requested data on the 'SolarBot Status Averages' report. I have been constantly saving my information. Here is what I have so far: Chart Title, X-Axis = Temp. Range & Status Date, Y-Axis = Average Panel Temp.
Thank you for any help you can give.
The X and Y axis values are not correct.
DeleteI am working on the first dashboard of challenge 3 and I get the error: Challenge Not yet complete... here's what's wrong:
ReplyDeleteAn incorrect source report is assigned to the 'Account Distribution' component.
The report it is referring to is the Accounts by Market report. I think that one is correct because I check each challenge as I go along and the report itself didn't get an error message.
This superbadge only has 1 dashboard and no "accounts by market" report. So... I'm a little confused. Which superbadge are you working on? Could you post to the blog page related to the superbadge?
DeleteStep 2
ReplyDelete#Number of SolarBots int visible inside column
What's the issue?
DeleteI am on Lightning Experience Reports & Dashboards Specialist step 6. Error I am getting: We can't find data organized by week on the 'SolarBot Status Averages' report.
ReplyDeleteI changed Status Date to Group by Calendar week. I changed Avg Percent Obscured, Average Panel temp and Average Kilowatt Hours to Avg and got rid of Sum. Turned off the row counts, detail rows, subtotals and grand total. Made a line chart with Avg Panel temp on x axis and Two lines avg Kilowatt hours and avg Panel temp on w axis.
Did you solve this?
Deletebro pls solve this issue from 2 days i am stucked at this point
DeleteHi Trailhead Baby,
ReplyDeleteI'm stuck on Lightning Experience Reports & Dashboards Specialist step 6. I'm receiving error "We can't find a graph displaying the requested data on the 'SolarBot Status Averages' report."
I changed Status Date to Group by Calendar week. I checked that Average Panel Temperature and Average Kilowatt Hours was spelled as listed in the challenge. Double checked the report title is spelled correctly. I have a line chart with the Status Date on X-axis. The Y-Axis is Average Panel Temperature. I used +measure to add Average Kilowatt Hours. Both lines are showing, but the y-axis measurement label lists the Avg Panel Temp. Turned off the row counts, detail rows, subtotals and grand total. I've saved multiple times after various changes. I've moved the legend to different spots. I'm not sure what else to try. Thanks for your help!
Same issue here. Have you ever received a suitable answer or resolved it otherwise?
DeleteExactly the same for me. Any luck?
DeleteI also get same problem and try to solve or checked as per comments given but it still show same error.
DeleteAnyone have solution please give
DeleteThanks for your information. very good article.
ReplyDeleteSalesforce CPQ Course
Salesforce CPQ Learning Path
your valuable information and time. Please keep updating.
ReplyDeleteLearn Salesforce CPQ
Salesforce CPQ Online Training
Hi everyone, I'm stuck on challenge 8 for the report Superbadge and cannot find my error. I keep getting: Challenge Not yet complete... here's what's wrong:
ReplyDeleteThe 'Opportunity Overview' component doesn't display data in the correct format or displays incorrect fields.
I'm showing the correct columns, the colors are set to be gray/blue at 20,000 and 50,000... sorted by stage/ascending... HELP?
Challenge Not yet complete... here's what's wrong:
ReplyDeleteWe can't find the correct access configuration for the SolarBot Support Reports folder.
pls help me to solve
ReplyDeleteThe 'SolarBot Pipeline by Stage' component doesn't display data in the correct format or doesn't show both side-by-side bars correctly. Or the dashboard needs to be refreshed.
ReplyDeleteHi sir please solve my problem
ReplyDeleteThe 'SolarBot Status Page With Chart' Lightning app doesn't use the chart from the 'SolarBot Status Averages' report with data specific to the SolarBot.
We can't find a page with the name 'SolarBot Status Page With Chart'.
ReplyDeleteYou have written very well here, I read it, I have also written something like yours, you would love to read it. click here
ReplyDeleteHello, I am stuck try to find the Kilowatt Hours. This is the error The 'SolarBot Status Averages' report doesn't show the correct fields.
ReplyDeleteWe can't find a page with the name 'SolarBot Status Page With Chart'.I cant save the page error is showing me "Developer name has to be unique" please advice me how to save this page.
ReplyDeleteChallenge Not yet complete... here's what's wrong:
ReplyDeleteWe can't find a graph displaying the requested data on the 'SolarBot Status Averages' report
Challenge Not yet complete... here's what's wrong:
ReplyDeleteWe can't find a graph displaying the requested data on the 'SolarBot Status Averages' report.
We can't find a graph displaying the requested data on the 'SolarBot status Averages' report
ReplyDeleteFallen Victim to Online Fraud? We're Here to Help.
ReplyDeleteOnline scams are on the rise, affecting countless individuals worldwide. At Mikhail Group Programmer Cyber Security ORG, we provide expert support and guidance for those impacted by digital fraud.
Our Expertise:
Our experienced team utilizes advanced tools to track and pursue recovery solutions, ensuring confidentiality and care. We handle cases involving:
- Fake investment platforms
- Crypto and forex scams
- Expert Option
- Online trading scams
- Donation scams
- Hacked wallets
- Phishing and fake platforms
- Online job and task fraud
- Romance and relationship scams
- Invoice and business scams
Take the First Step:
If you're seeking a way forward, we're here to help. Request a private consultation today.
Contact Us:
Email: mikhailgroupprogrammercybersec@gmail.com
contact@mikhailgroupprogrammercybersecurity.org
Confidential and Non-Judgmental Support:
We offer guidance you can trust, without pressure or assumptions.
I’ve spent months searching for good opportunities, and honestly, most job portals just waste your time with outdated or irrelevant posts. That changed when I came across Jobs in Gurgaon on JobCrate. It’s one of the few platforms where the listings are fresh, easy to filter, and actually worth applying to. If you're serious about your next career move, I’d definitely recommend checking it out.
ReplyDelete